MapPlace 2 sample exercises
Exercise 4: Map creation
Having outlined an area that you consider would meet your company’s needs, you want to create a map to include in your presentation to the CEO and, eventually, the rest of the board of directors.
The first part of this exercise uses the property outline created in the previous exercise. If you have started a new MapPlace session, recreate the outline using the Redline tool before continuing to Step 1.
Step 1: Adjust the zoom level to show the claims in a more regional context. With the map window centered on the property outline, enter 100000 in the Map Window Scale Box.
![]()
Step 2: Display base map layers.

In the Legend pane turn on the Base Maps folder and the Topographic - Water Bodies and Topographic - Contours West layers from the Topographic Features folder.
 Data for the Base Map layers are extracted from the OpenStreetMap database.
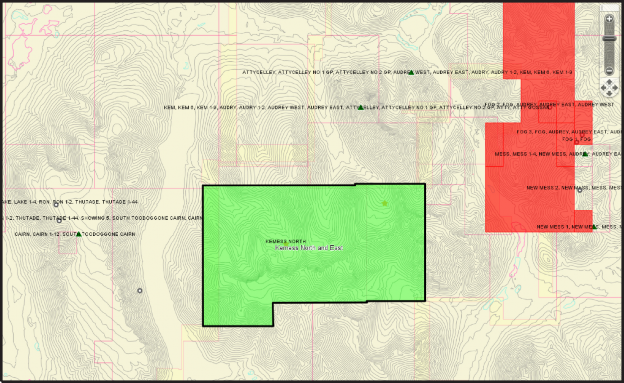
Step 3: Create the map.
a) In the toolbar click the Quick Plot button.
b) Adjust the map settings in the Tasks pane.
i) Change the title to ‘Kemess North and East Claims’.
ii) Change the Sub title to ‘Interested in Option Agreement’.
iii) Under Show Elements turn on Legend, North Arrow, Coordinates and Scale Bar.
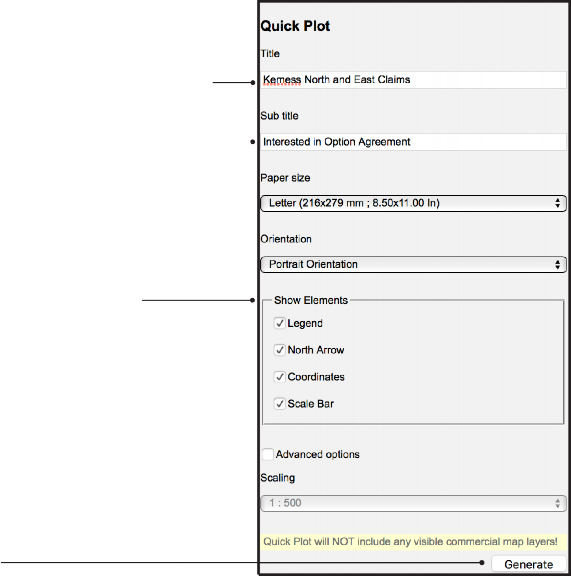
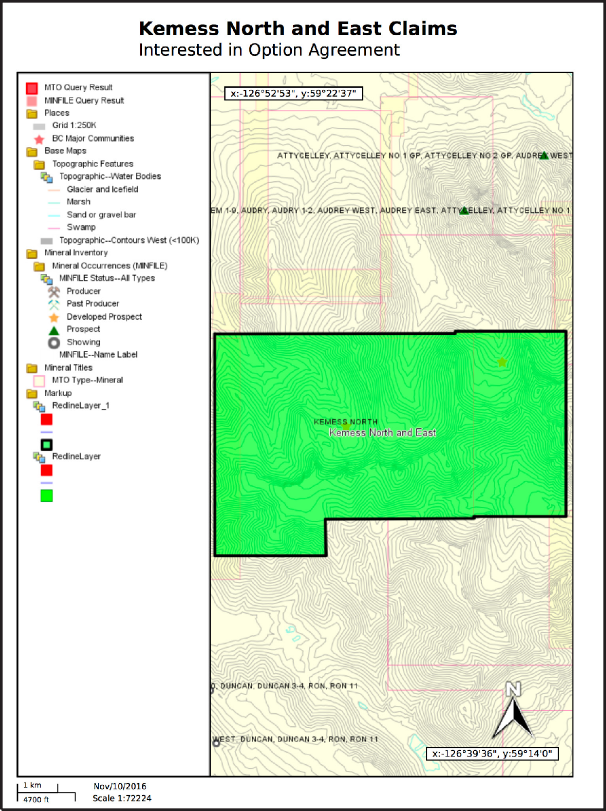
c) Click Generate.
This creates a map that you can print, download as a pdf file, and incorporate into your documents.
Fast forward a year. Your company followed your advice and entered into an option agreement for the Kemess North and East prospect. You are writing an assessment report and need to create property location and claim maps.
First, create the property location map.
Step 4: Create a point centered near the middle of the property.
a) In the toolbar, click the Redline button.
b) Under Create New Redline in the Task pane, deselect Polygon and Line.

c) Click the SHP button.
d) Click the Point button.
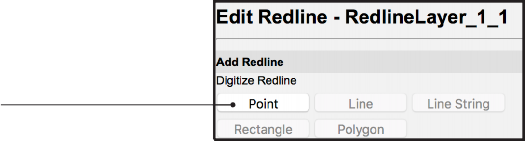
e) Place your cursor near the middle of the property and left click to create the point.
Step 5: Label the point with the property name.
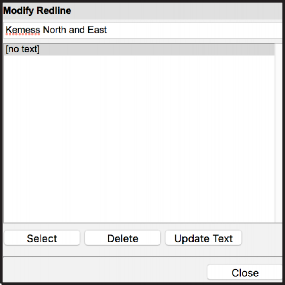
a) Update the text label by typing ‘Kemess North and East’ in the text box under Modify Redline and then Click Update Text.
b) Click Close.
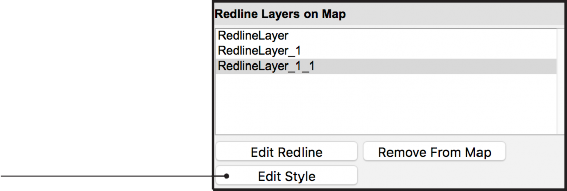
Step 6: Change the point style to ensure it is visible in the final map.
a) To change the point style, under Redline Layers on Map, select the redline layer with your point (RedlineLayer_1).
b) Click Edit Style.
c) Under Point Style, change Marker Type to Star and change the Marker size to 40 to make the point visible when zoomed out to see the whole province.
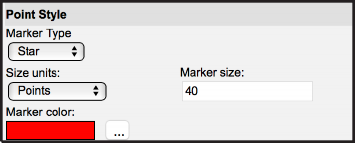
d) Click the OK button at the bottom of the pane.
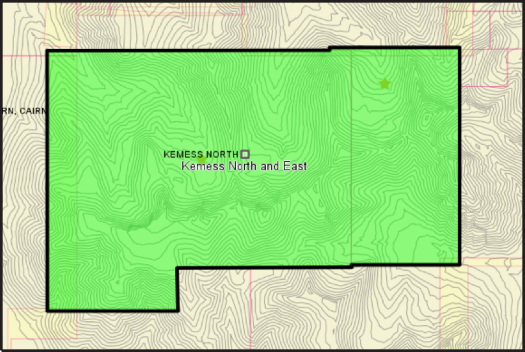
Step 7: Zoom out to view the point at the province scale.
In the toolbar, click the Zoom Extents button to see the whole province.
![]()
a) In the Legend pane, turn on the Open Street Map folder within the Base Maps folder and the Provincial Border layer in the Administrative Boundaries folder (this will add the proper base map to the map you create).
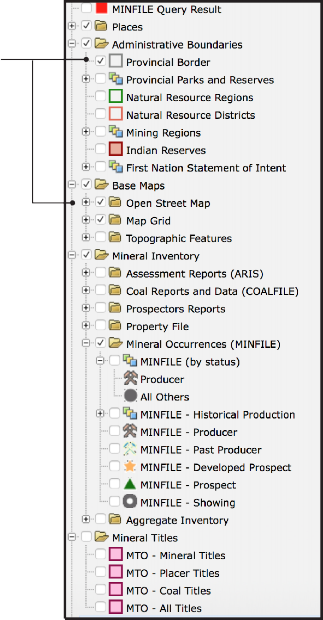
b) If the following layers are still turned on, turn them off: MTO Query Result, MINFILE Query Result, MINFILE (by status), MTO - Mineral Titles.
Step 9: Create the property location map.
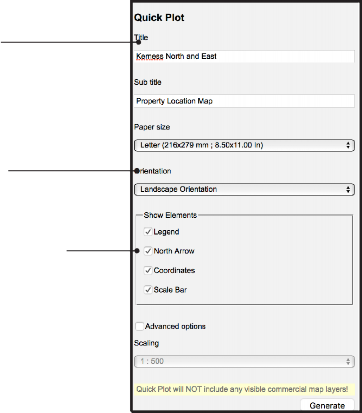
a) Click the Quick Plot button in the toolbar.
![]()
b) Enter Kemess North and East in the Title box and Property Location Map in the Sub title box.
c) Change the Orientation to Landscape Orientation.
d) Turn on the Legend, North Arrow, Coordinates and Scale Bar under Show Elements.
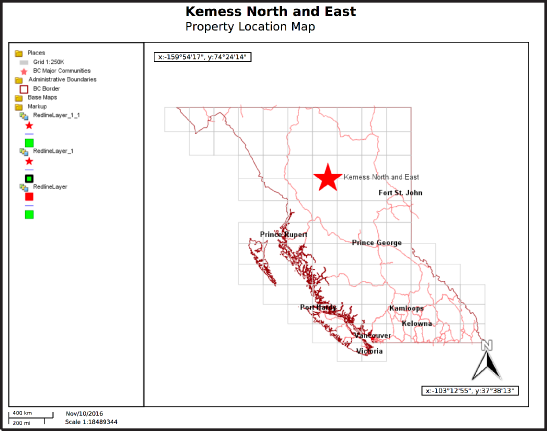
e) Click Generate.
You have now created a pdf property location map that can be included directly into your assessment report.
Next create a labelled 1:100,000-scale claim map.
Step 10: Hide the Redline layers.
In the legend pane, turn off the RedlineLayer_1 and RedlineLayer layers under the Markup folder (this will hide the property location point and outline polygon you created above).
Step 11: Zoom in to the property area.
Use the Zoom Rectangle tool from the toolbar to manually zoom and center the map window to the extent of the property.
![]()
Step 12: Display tenure data.
Turn on the MTO - All Titles layer.

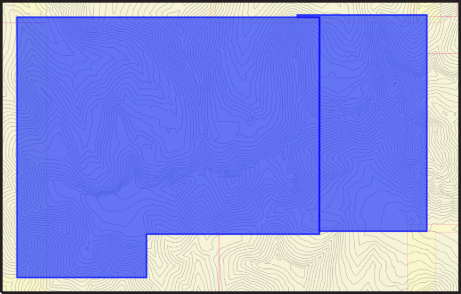
Step 13: Create an outline of the two claims included in the property.
a) Click the Select button in the toolbar and manually select the two claims that make up the property (shift + left click to select the second claim).
![]()
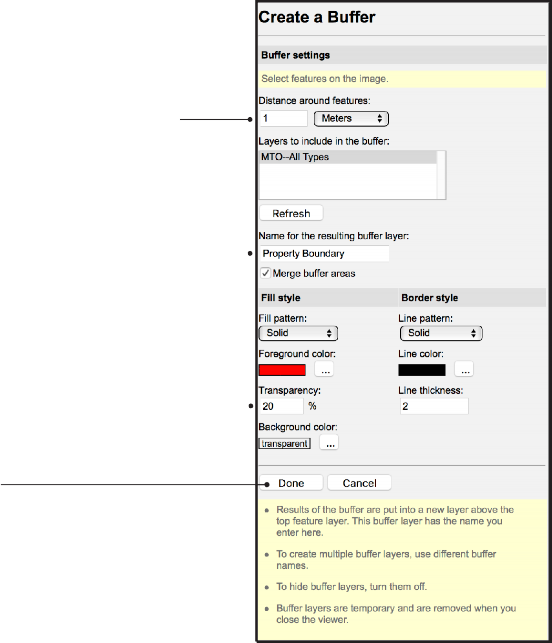
b) Click the Buffer button in the toolbar.
![]()
c) Set the Distance around features to 1 meter.
d) Change the name of the resulting layer to Property Boundary.
e) Change the transparency to 20% and the Border line thickness to 2.
f) Click Done.
 What other MapPlace 2 tool can be used to create a property outline?
 a) On the toolbar, click Clear Selection.
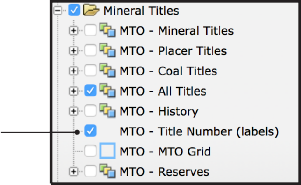
b) In the Legend pane, turn on the MTO - Title Number (labels) layer.
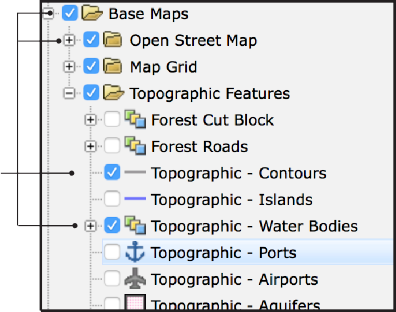
c) Ensure the Base Maps and Open Street Map folders, Topographic - Water Bodies and Topographic - Contours layers are turned on in the Legend Pane.
Step 15: Create the map.
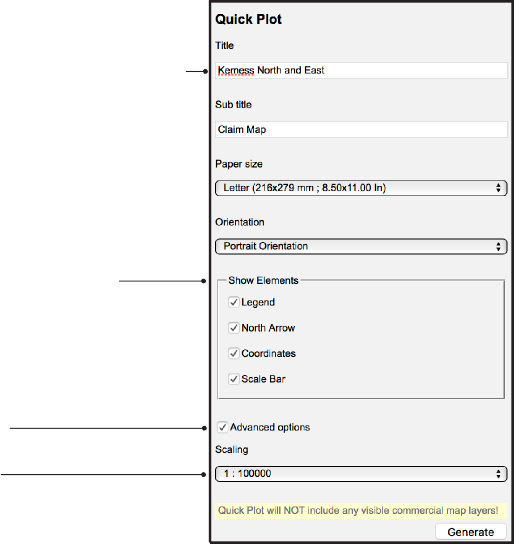
a) In the toolbar, click Quick Plot.
![]()
b) In the Tasks pane, set the Title as ‘Kemess North and East’ and the Sub title as ‘Claim Map’.
c) Turn on all the options under Show Elements.
d) Turn on Advanced Options.
e) Set Scaling to 1: 100000.
f) A blue box appears in the Map Window showing the extent of the map that will be created, if necessary, center the blue box onto the claims.
g) Click Generate.
You now have a 1:100,000-scale claim map that can be directly included in your assessment report.

In this exercise you used the Quick Plot, Redline, and Buffer tools to create maps that can be directly incorporated into your documents and presentations. You first created a map outlining the area of interest you identified in previous exercises. You then created property location and claims maps with all the elements required of an assessment report.
Datasets used in this exercise:
• Base Map and Topographic layers
• MTO Tenure
Tools used in this exercise:
• Quick Plot
• Redline
• Buffer