MapPlace 2 Interface
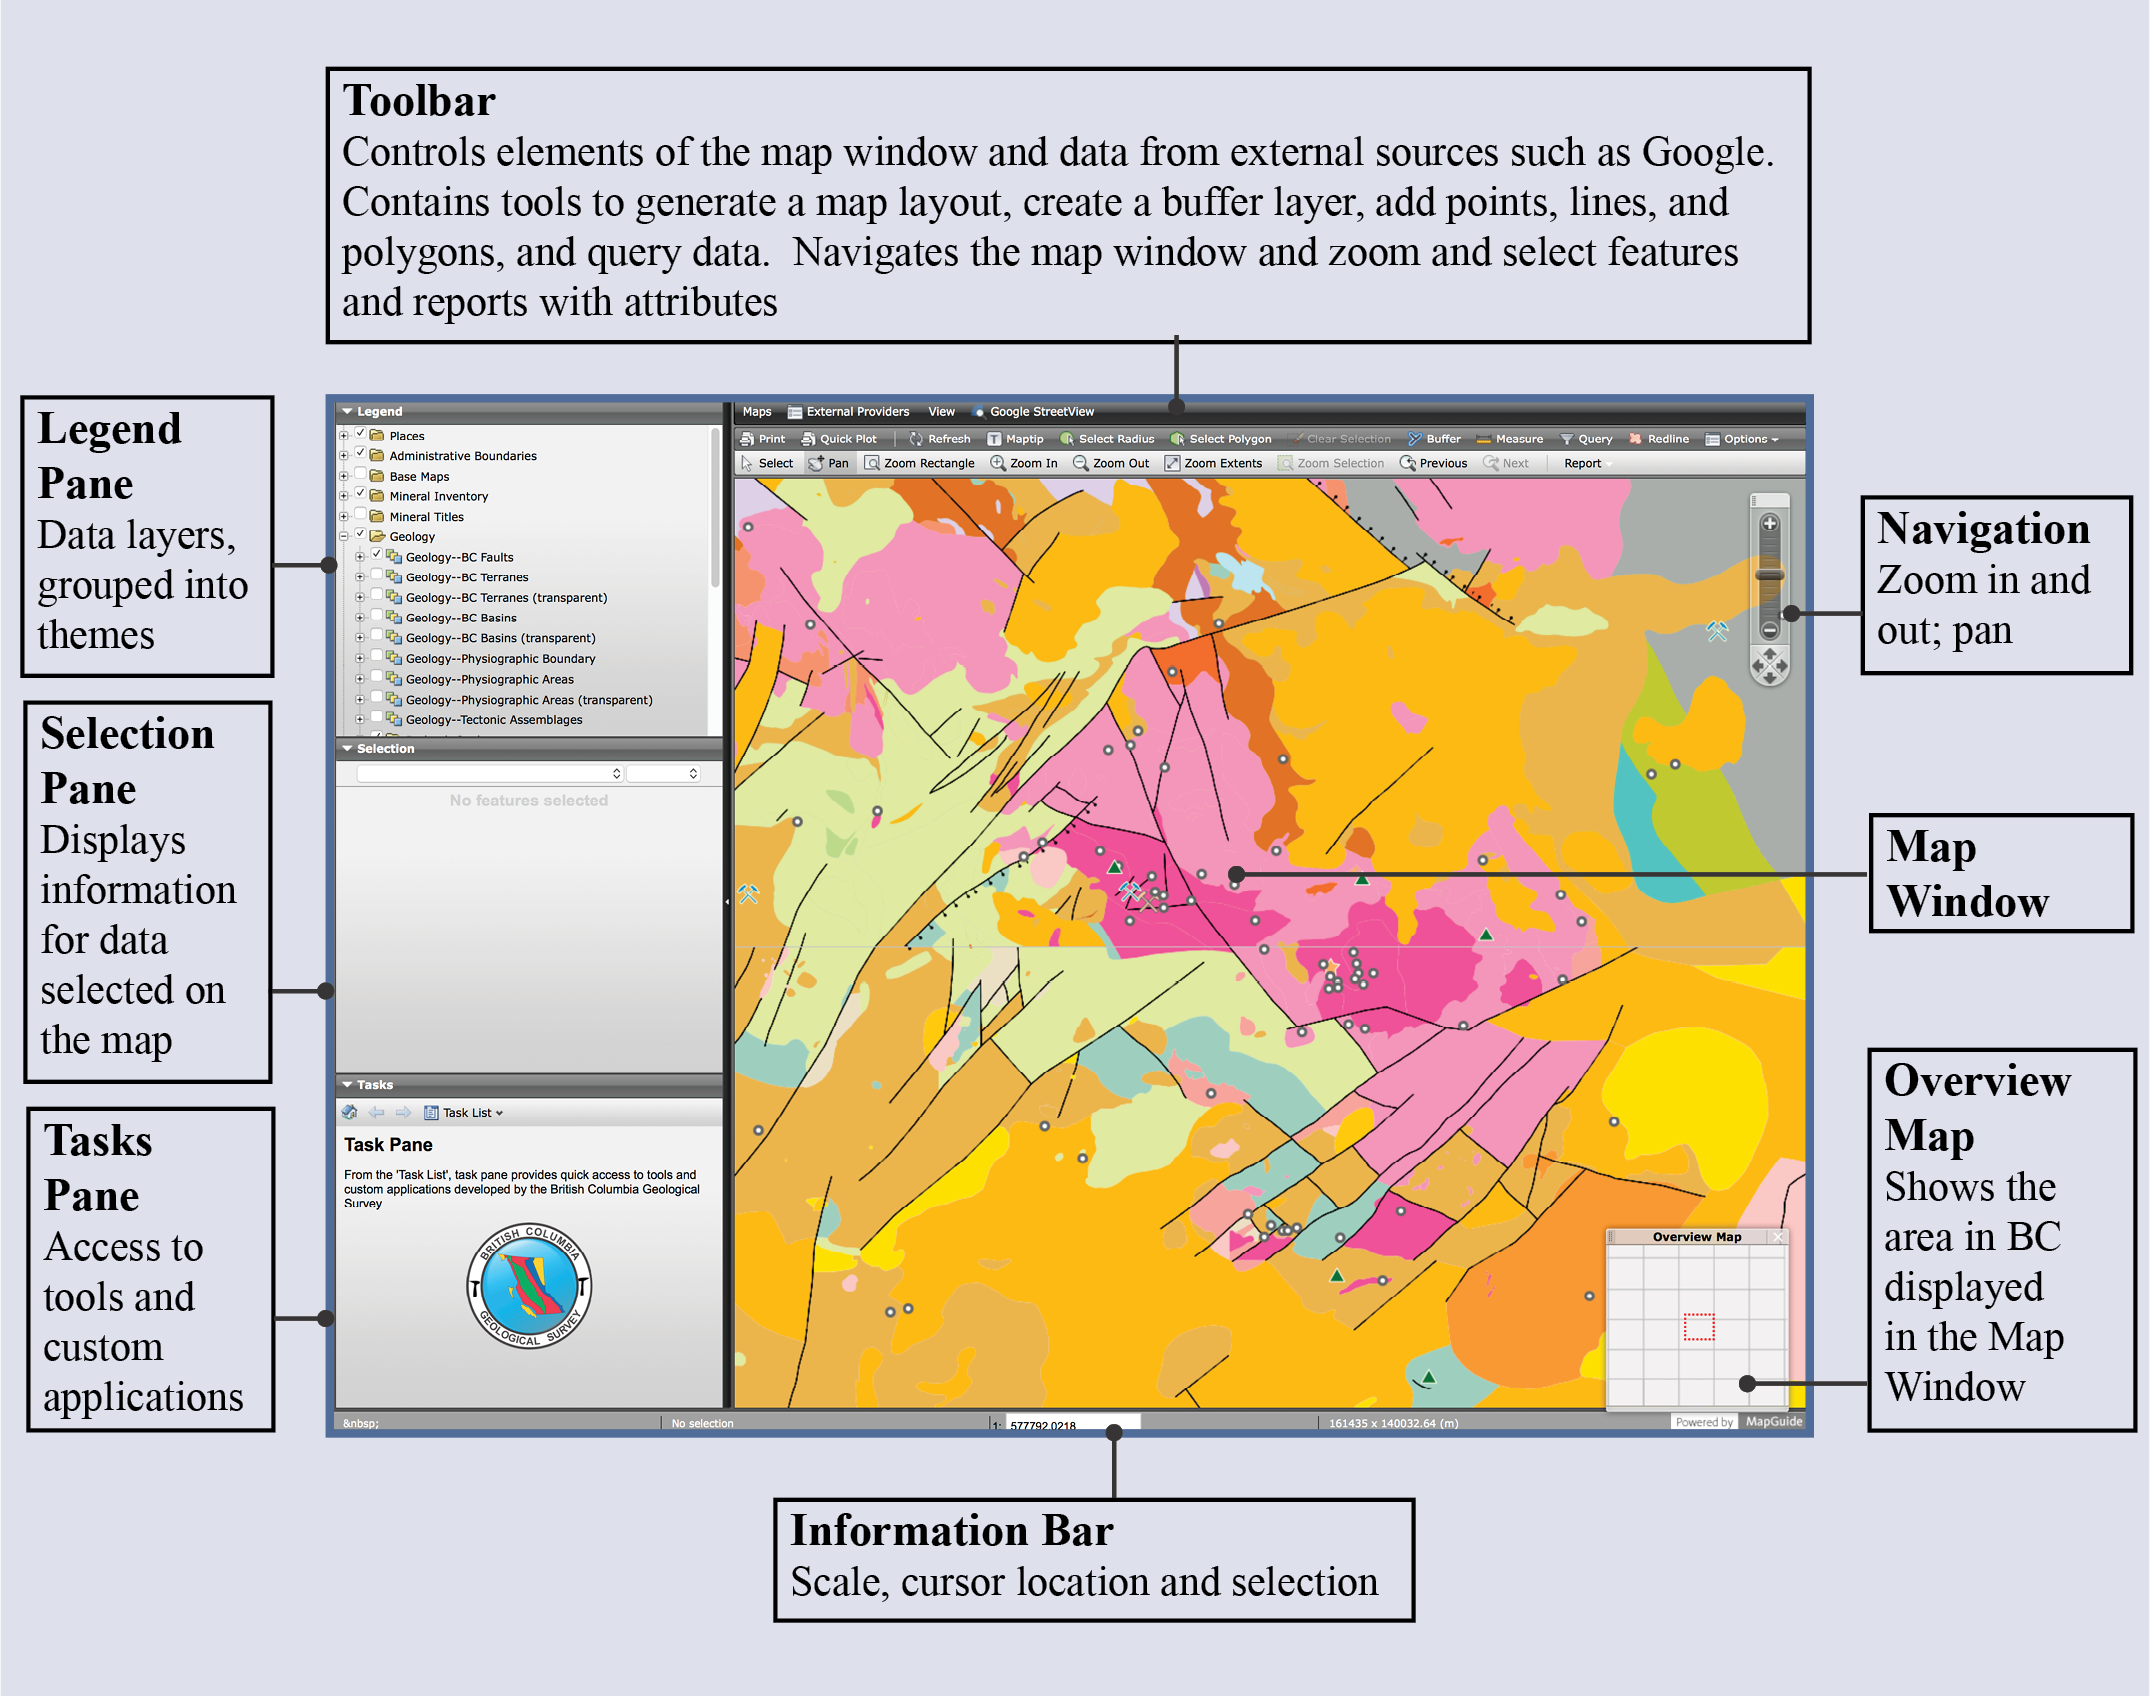
Toolbar
First Ribbon
The first ribbon on the toolbar controls elements of the map window and displays data from external providers.
![]()
Maps
Click to display a drop down of available themed maps (currently only default theme).
External Providers
Click to display a drop down menu of available base maps from external providers like Google or Open Street Map.
View
Toggle display of the Overview Map, Legend Pane, Selection Pane and Tasks Pane.
Google StreetView
Display Street View, Photo Sphere, and ‘See inside’ in Tasks Pane when one of the Google maps is turned on and StreetView is available. The magnifying glass can be dragged and moved to desired locations.
Second Ribbon
The second ribbon on the toolbar contains tools to select features by radius or a polygon, create buffers, add text, points, lines, and polygons, and generate custom maps for print-out or to be saved as PDF.
![]()
Create a quick print of what is currently displayed in the map window with optional title, legend and north arrow.
Quick Plot
Similar to Print , but with more options for customizing your map layout.
Refresh
Refreshes the data in the map window.
Maptip
Click to enable and disable Maptip, which will show attribute data when you hover the mouse pointer over features in the map window.
Select Radius
Click and drag to select features within a radius.
Select Polygon
Select features within a polygon; click to start and click again to create as many nodes as you need, when you are done double click to complete the polygon and the data within will be selected.
Clear Selection
If features are selected, click to deselect.
Buffer
Create a new, customizable layer (referred to as a buffer) to select features in the Tasks Pane.
Measure
Click to measure distance and and size of an area.
Query
Opens the Query Features within the Pane.
Redline
With the Redline tool, add text, points, lines, and polygons.
Options
Click to display the drop down menu and choose the units displayed when measuring a feature.
Third Ribbon
The third ribbon of the toolbar contains tools to help you navigate the map window, zoom in and out, and select data. It also contains a dropdown menu to display custom reports for the data selected.
![]()
Select
Click to select a feature or click and drag to select multiple features within a rectangle
Pan
Click and drag to pan the map.
Zoom Rectangle
Click or click and drag on the map to zoom in.
Zoom In
Zoom in on the map by a preset increment.
Zoom Out
Zoom out on the map by a preset increment.
Zoom Extents
Click to zoom in to the full map extent; this will show all of BC in the map window..
Zoom Selection
If you have selected features in the map window you can zoom into your selection.
Previous
Click to go to the previous view.
Next
If you have clicked ‘previous view’ this will take you back to the next view.
Report
Custom reports are available for features you selected. Select the desired features, then click the report dropdown button and choose your report. Some reports contain links to more details from BCGS databases, download as Excel, and display on Google Earth (KML).
Information Bar
Displays cursor position, number of selected features and layers, scale, and the dimensions of the area displayed in
the Map Window. Units specified in Options within the Toolbar.

Panes: Legend, Selection, and Tasks
Legend Pane
In the Legend Pane are data layers that can be displayed and analyzed. To display the Legend Pane, click the drop down arrow. Alternatively, in the top ribbon of the Toolbar, click on View and choose Show Legend.
Data layers are grouped into themes.
Clicking the
![]() will expand the group to display the layers or sub-groups within. Clicking in the box
will display a check mark
and turn on the group and/or the layer. Tip: if the data are not displaying make sure the group is checked.
will expand the group to display the layers or sub-groups within. Clicking in the box
will display a check mark
and turn on the group and/or the layer. Tip: if the data are not displaying make sure the group is checked.
Selection Pane
When layers are turned on and features selected, the Selection Pane will show attribute data. In this example, the RGS Sample Location layer is turned on/ and sample point ‘1’ is selected. The sample ID, lithology, collection date and assay values are displayed, giving a brief view of the metadata without running a full report.
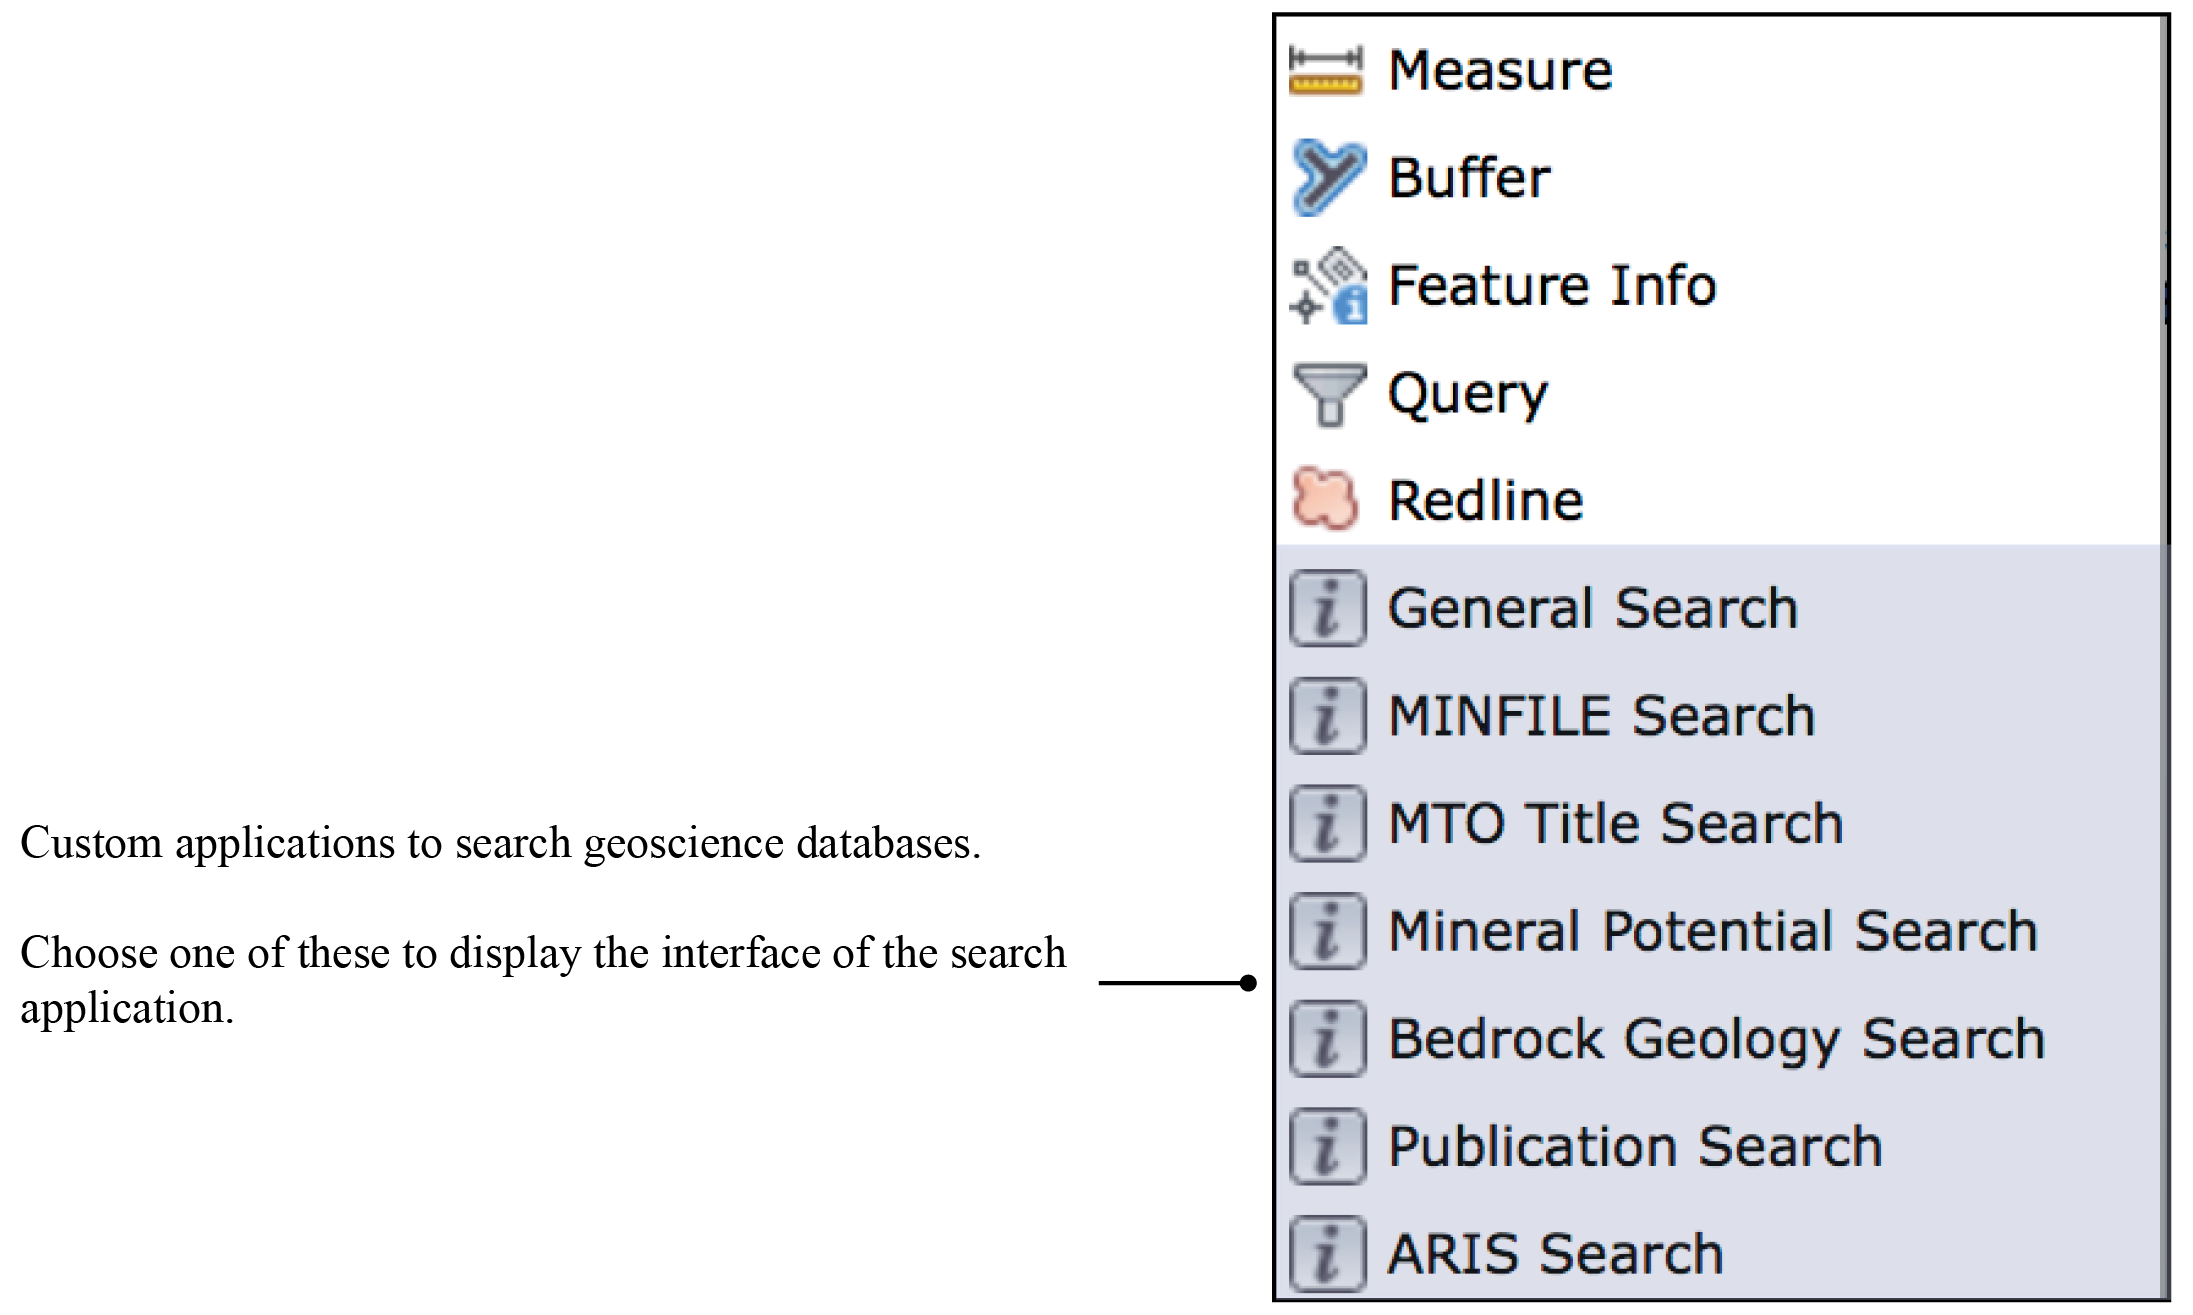
Tasks Pane
The Tasks Pane contains tools to search and analyze data available in the Legend Pane. Some of these tools are also available in the Toolbar and the Map Window menu.