MapPlace 2 sample exercises
You’ve just been hired by a new junior exploration company. As the only geologist, you’ve been tasked to identify the first prospect for the company to stake or option. The CEO has given you only two weeks to find a prospect that they can present to the board of directors, but has not given you a budget. Aware of renewed interest in BC’s porphyry copper deposits, the CEO has instructed you to focus on those only in areas with existing infrastructure. He also told you he is not interested in grassroots projects.
You are new to the province and start looking for information online. Having found the BCGS website, you come across the MapPlace 2 web service and immediately recognize its potential to help you get the job done.
Exercise 1: Interface and datasets
Step 1: To begin, you want to find a few porphyry copper occurrences where at least 450 million tonnes have been mined.
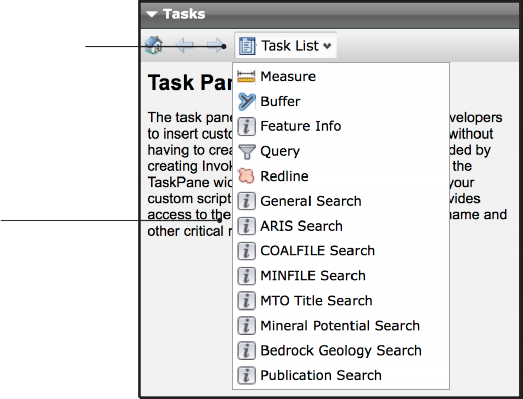
a) In the Tasks Pane, click on Task List.
b) Click MINFILE Search.

 MINFILE contains geological, location, and economic information about more than 14,600 metallic, industrial mineral and coal mines, deposits and occurrences in B.C.
c) Scroll down to the section labelled DEPOSIT COMBINATION SEARCH.
d) In the Keywords box enter: porphyry, copper.
e) In the Tonnes mined box enter: 450000000
f) Click Go!
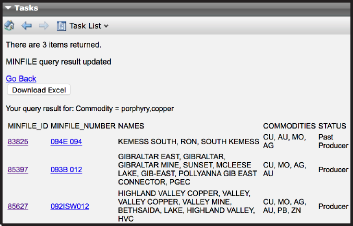
Through this search you’ve identified 3 occurrences of interest: MINFILE numbers 094E 094, 093B 012, and 092ISW012.
MINFILE numbers are nine characters long. The first four are NTS map sheets (e.g. 094E), followed by the map quadrant (e.g. SW) and then a sequential number (e.g. 012). Note that when the quadrant is not listed the two spaces are present in the number.
For each occurrence repeat the following steps.
Step 2: Search for the MINFILE occurrence using the ‘MINFILE Search’ task to centre the map window directly around the area of interest (for the first occurrence you can skip to part c of this step).
a) In the Tasks pane, click Task List and then MINFILE Search.
![]()
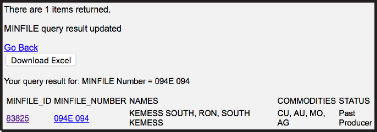
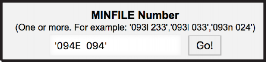
b) In the box under MINFILE Number Finder enter the occurrence number within single quotes (eg. ‘094E 094’) to search then click Go!
c) Click the MINFILE_ID to zoom in to the occurrence (e.g. 83825).
Step 3: Adjust the scale to about 1:250K to get a better view of the surrounding area.
![]()
a) On the Information Bar enter 250000 in the Map window scale box and hit the Enter key (note that the value in the box will change to 2888896.0109; this is normal and happens because the interface works with predetermined zoom level).
Step 4: To get a better feel for the topography, change the base map to Google Physical.

a) On the Toolbar click External Providers.
b) Click Google Physical (if the base map doesn’t change automatically, click the Refresh button in the Toolbar).
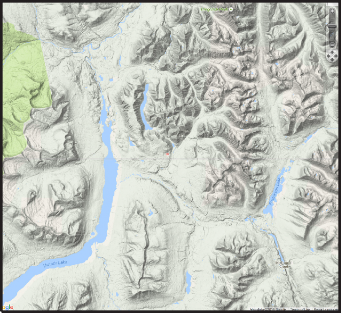
Google Physical as base map.

Step 5: View other occurrences in the area. In the Legend pane expand the Mineral Inventory folder by clicking the ‘+’. Then turn the folder on by clicking the empty checkbox to the left of the folder name.
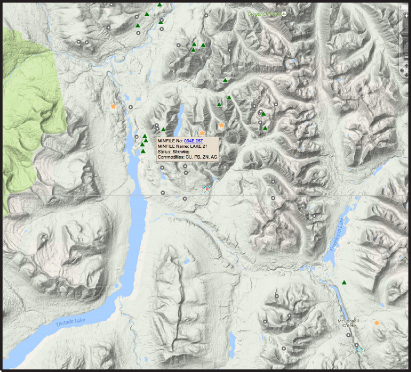
 How many developed prospects can you see in the Map Window?
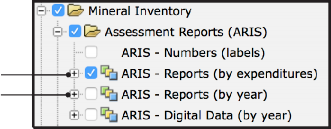
Step 6: To determine the value, timing, and distribution of past work in the area, examine the ARIS layers.
a) Turn on the ARIS - Reports (by expenditures) layer.
b) Turn off the ARIS - Reports (by year) layer (within the Assessment Reports (ARIS) folder).
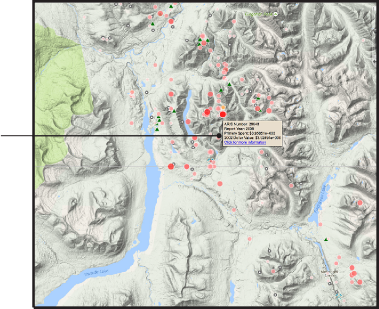
c) Hovering over points will reveal maptips displaying key attributes. You can also pan around the screen and zoom in and out to areas of interest.

d) Turn off the ARIS - Reports (by expenditures) layer.
e) Turn on the ARIS - Reports (by year)layer.
f) Expand the ARIS - Reports (by year) layer to see its legend.
ARIS is the BCGS Assessment Report Indexing System. It contains over 35,600 mineral exploration assessment reports filed by the exploration and mining industry since 1947.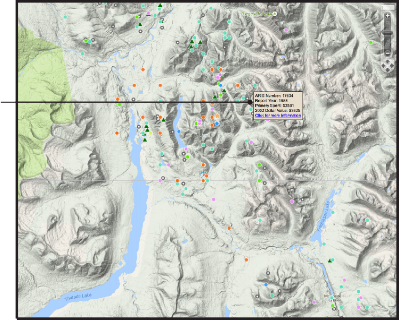
g) Hover over points to see the exact year in which the work was completed.
h) Turn off the ARIS - Reports (by year) layer.
Can you identify three assessment reports submitted since 2010?Step 7: To relate the work that has been done to the geology, examine the bedrock geology layers/
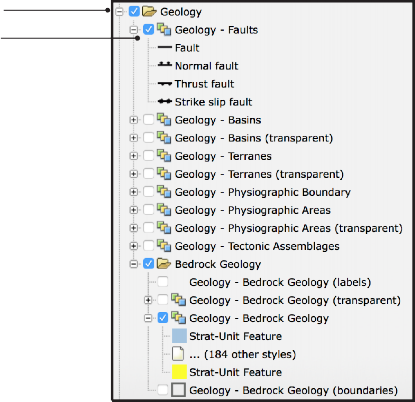
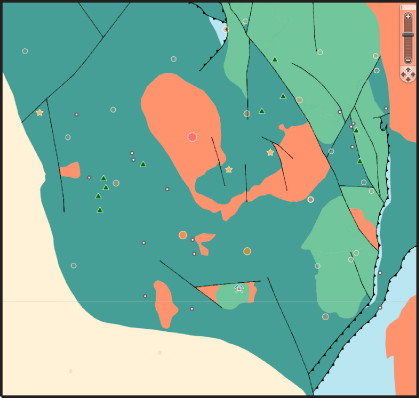
a) Turn on and expand the Geology folder.
b) Turn on the Geology - Faults layer.
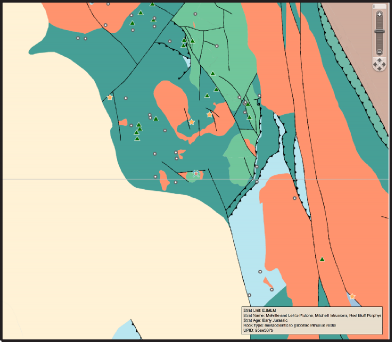
c) Use the maptips and selection tools to get information on the different rock types. Zoom and pan around the area to get an understanding of how occurrences relate to geology. See if you can identify any trends.

The geology data in MapPlace 2 are obtained from the British Columbia Digital Geology, which provides up to date province-wide coverage of bedrock geology.
Can you identify a stratigraphic unit that is spatially related to developed prospects?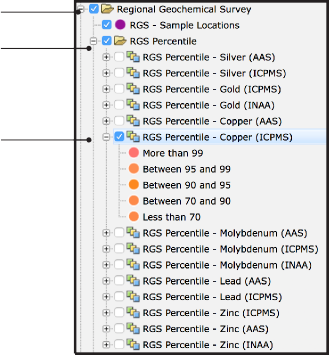
a) Turn on and expand the Regional Geochemical Survey folder.
b) Turn on and expand the RGS Percentile folder.
c) Turn on the RGS Percentile - Copper (ICPMS) layer then turn on the RGS Percentile - Copper (AAS) layer and compare the results.
d) Pan and zoom to see if you can identify any correlation between these results and MINFILE occurrences, rock types or faults.

The Regional Geochemical Survey (RGS) dataset includes analyses for almost 65,000 stream and lake sediments and water samples across the province.
How many RGS samples in the 99th percentile can you see in the Map Window?In this exercise, you used MapPlace 2 to identify three target areas by searching the MINFILE database. Using the ARIS database, you established the level of previous work in these areas. You then determined the relationship between MINFILE occurrences and lithology, structure, and geochemistry by using the Bedrock Geology and Regional Geochemical Survey databases. Linking to an external provider (Google Physical) enabled you to examine the topography of the areas. You used the data visualization capabilities of MapPlace 2 to conduct a preliminary assessment of each target area.
Datasets used in this exercise:
• Google Physical Basemap
• MINFILE database
• ARIS (Assessment Reports)
• Bedrock Geology
• Regional Geochemical Survey
Tools used in this exercise:
• External Providers (base maps)
• MINFILE Search
• Map Window Scale Box
• Legend Pane
• Tasks Pane