MapPlace 2 sample exercises
Exercise 2: Selection, reports, and downloads
After considering the data available for each area you’ve decided to eliminate the area around the Highland Valley occurrence (092ISW012). Because so much work has been done in the area in the last six years, you’re not sure that you could productively insert your company into the area.
You also eliminated the area near Gibraltar (occurrence 093B 012) because the potential seems to be limited to the immediate area near the occurrence itself, with little prospect of further nearby discoveries.
You found the area near Kemess South (094E 094) to be the most interesting. It contains several porphyry copper prospects and developed prospects. The numerous assessment reports suggest that interest in the area has been sustained over several decades, something your company could build on.
Now that you’ve narrowed your interest to the area surrounding the 094E 094 (Kemess South) occurrence, you want to take a closer look at the data available. You use MapPlace 2 to access MINFILE record summaries, assessment reports, regional geochemical results, and lithology reports.
Step 1: Find and zoom in to the Kemess South showing.
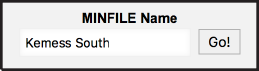
Enter Kemess South in the MINFILE Name search box of the MINFILE Search task (Tasks pane/Task List/MINFILE Search). Select the MINFILE_ID link to zoom to the occurrence.
Step 2: Set the map window scale to a level that gives a good regional view of the area.
Enter 150000 in the Map Window Scale Box. Note: the scale will not be exact as the map has step zooms.
Take a closer look at the other showings surrounding Kemess South and further focus your area of interest.
Step 3: Display MINFILE occurrences on the map.
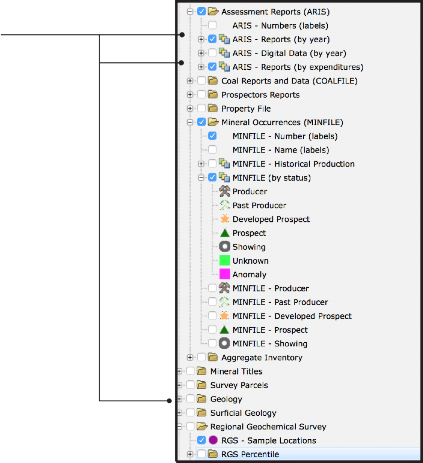
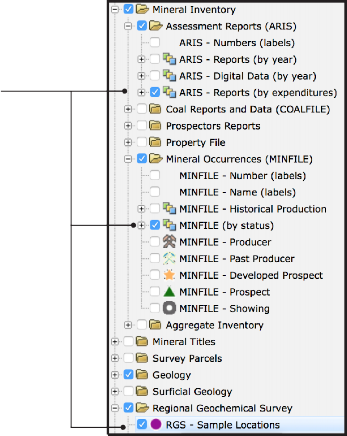
Turn on the MINFILE (by status) and MINFILE - Number (labels) layer.

MINFILE displayed with labels.

Step 4: Select all the occurrences in the Map Window.
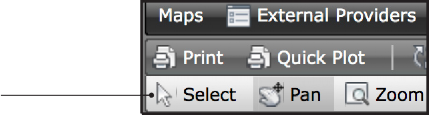
a) Turn on the select tool from the toolbar.
b) Start the selection by moving the cursor in the top left corner of the map window. Then click and hold the left button while dragging the cursor down to the lower right corner of the map window. Release the left button once the rectangle covers the whole window.

 How many occurrences have you selected?
Step 5: Get an easy-to-read summary of all of the occurrences selected.
a) Right click anywhere in the Map Window
b) In the pop-up menu, select Mineral Inventory Reports then MINFILE status report.

c) Re-sort the report by occurrence Status by clicking the column header.
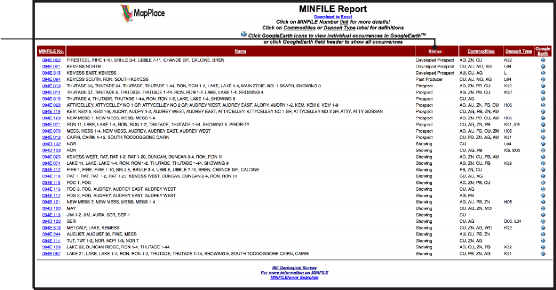
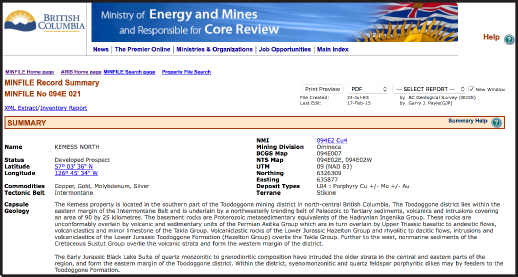
Which developed prospect lists copper as the main (first) commodity?d) The Kemess North showing is a developed prospect with copper as the main commodity. Click the MINFILE No. (ie. 094E 021) to get a detailed summary.
How many showings or prospects can you find that have copper as their main commodity that may be porphyry related?Step 6: You can use many other databases to create summaries such as the ones you generated for MINFILE. To speed things up, select data from multiple databases at the same time.
a) Turn on the ARIS - Reports (by year), ARIS - Reports (by expenditures) and RGS - Sample Locations layers from the Legend pane.
b) Click the Select Polygon button on the toolbar.
c) Left click in the top left corner of the Map Window, then the top right and bottom right corners. Move the cursor to the bottom left corner (you should see a selection polygon). Once you are happy with the shape and coverage of the polygon, double click in the last corner to Turn on the selection.

Step 7: View the assessment reports available in the area to determine what has been done and by whom.
a) Generate a report of all of the assessment reports selected by clicking Reports in the toolbar then Mineral Inventory Reports and ARIS (by year).

What was the total work cost reported in the most recent report?
b) Download the list of reports as an Excel file by clicking the download in Excel format button.

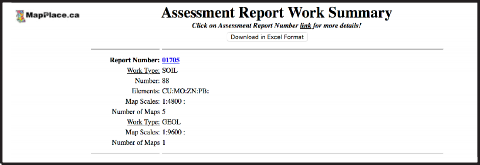
c) See the data summaries available in the three different report views available by following the links under Click to View.
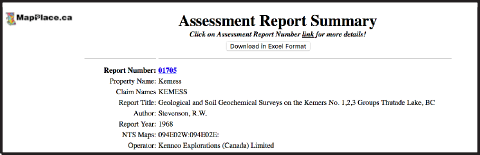
 When downloading data sets, set up a working directory (folder) on your computer.What is the name of the company that filed the first assessment report in the area?
d) Click the report number to get the detailed report summary and access to the pdf and digital data files (if available).

e) Close the ARIS report window.
Step 8: Rather than trying to recompile all the raw data in the ARIS reports, use the RGS layers to view analytical results from samples taken in this area.
a) From the toolbar, click the Reports button and then in the RGS Reports section select RGS - Sample Locations.

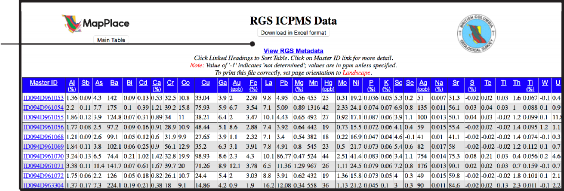
b) View tabulated results for different types of analyses by clicking the buttons under View data by.

What is the highest ICPMS copper value reported in the area?c) Download a full set of results for the selected samples for later viewing by clicking the Download in Excel format button.
Step 9: The RGS report revealed samples with elevated copper. Go back to the MapPlace interface and use the RGS Percentile layers and the Google Hybrid base map to view RGS results with respect to topography.
a) On the toolbar click on Clear Selection.
b) Turn off the ARIS, MINFILE, Property File and RGS Sample Location layers.
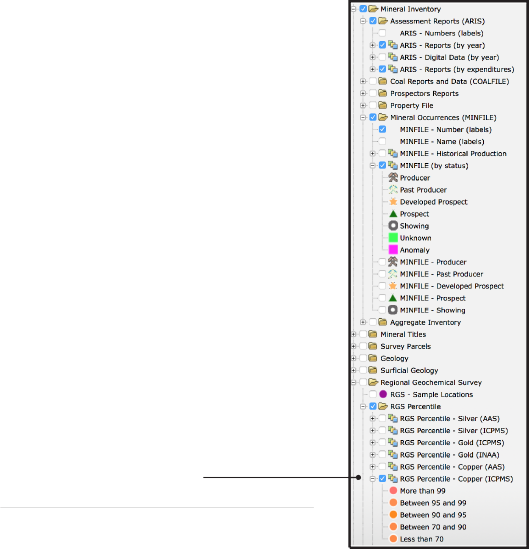
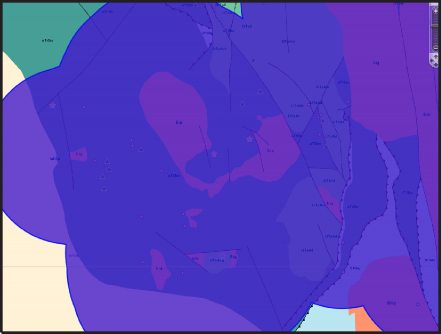
c) Turn on the RGS Percentile/RGS Percentile - Copper (ICPMS) layer.
Are any samples in the area ranked in the 99th percentile?d) Change the base map to Google Physical using the External Providers menu on the toolbar.
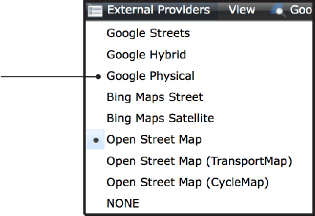

e) Pan and zoom around the area to get a closer view of each sample.
Using the topographic base map, can you identify a possible source for the sample with the highest copper value?f) Turn off the RGS Percentile - Copper (ICPMS) layer.
![]()
Step 10: Looking for additional targets, test if the geology of nearby showings is similar to that at Kemess South.
Turn on the Geology - Bedrock Geology, Geology - Bedrock Geology (labels), Geology - Faults and MINFILE (by status) layers from the Legend pane.

Can you identify an intrusive rock unit that is spatially related to the Kemess South deposit and that may be related to other developed prospects?Step 11: You found that the showings are spatially related to Early Jurassic intrusive rocks (EJg), so refine your search of ARIS, MINFILE and RGS data to only points within 5km of EJg units.
a) Select all of the EJg polygons visible in the Map Window.
i) Turn on the select tool from the toolbar

ii) Left click to select the polygon (press and hold the shift key while you left click to select multiple features). Note that you can zoom in and out as you do this to help select smaller polygons.

b) Create a 5km buffer around the selected features to be used for selecting other data.
i) On the toolbar, click the Buffer button.
ii) Under Distance around features set the distance to 5 kilometers.
iii) Ensure the Geology - Bedrock Geology layer is selected under Layers to include in the buffer.
iv) Under Name for the resulting buffer layer: change the name to EJg_5km.
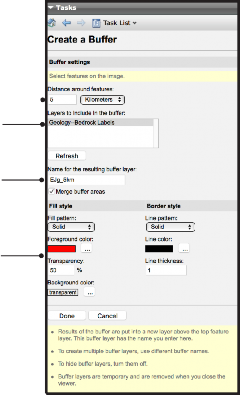
Note: this name will be shown in the Legend and cannot be changed once the buffer is created.
v) Leave the Fill and Border style as they are (Note that, as with the layer name, the styles cannot be changed once the buffer is created) and click Done.

c) Select all ARIS, MINFILE and RGS points in the buffer area.
i) Left click anywhere in the buffer polygon.
ii) Turn on the ARIS, MINFILE and RGS layers to be selected from.
iii) Right click anywhere in the Map Window.
iv) From the pop-up menu, go to Select More then click on Select within.
v) Under Restrict results to selected layers select ARIS - Reports (by year), MINFILE (by type) and RGS - RGS Sample Locations (hold the Ctrl key while you left click on layer’s names to select multiple layers at once).

vi) Click Done to complete the selection.
Step 12: Using the same procedures as in Steps 7 to 9, create reports and export Excel listings for the selected ARIS, MINFILE and RGS data.
In this exercise, you used the MapPlace 2 reporting tools to access detailed summaries of MINFILE occurrences, ARIS reports, and RGS samples in the area surrounding the Kemess South occurrence.
You then used the bedrock geology layer to identify a stratigraphic unit spatially related to the Kemess South mine and Kemess North and East developed prospects. Using a buffer around this stratigraphic unit you refined your search of the MINFILE, ARIS, and RGS databases and used the download tool to save spreadsheets of occurrences, reports, and samples.
You now have all the information you need to evaluate the prospects in this area.
Datasets used in this exercise:
• MINFILE
• ARIS
• RGS
• Google Hybrid base map
• Bedrock Geology
Tools used in this exercise:
• MINFILE Search
• Reports
• Simple Select
• Select Polygon
• Buffer
• Select Within